Geologic Mapping
The original version of this document is located at https://docs.qfield.org/success-stories/geologic-mapping
Geologic Mapping with QField
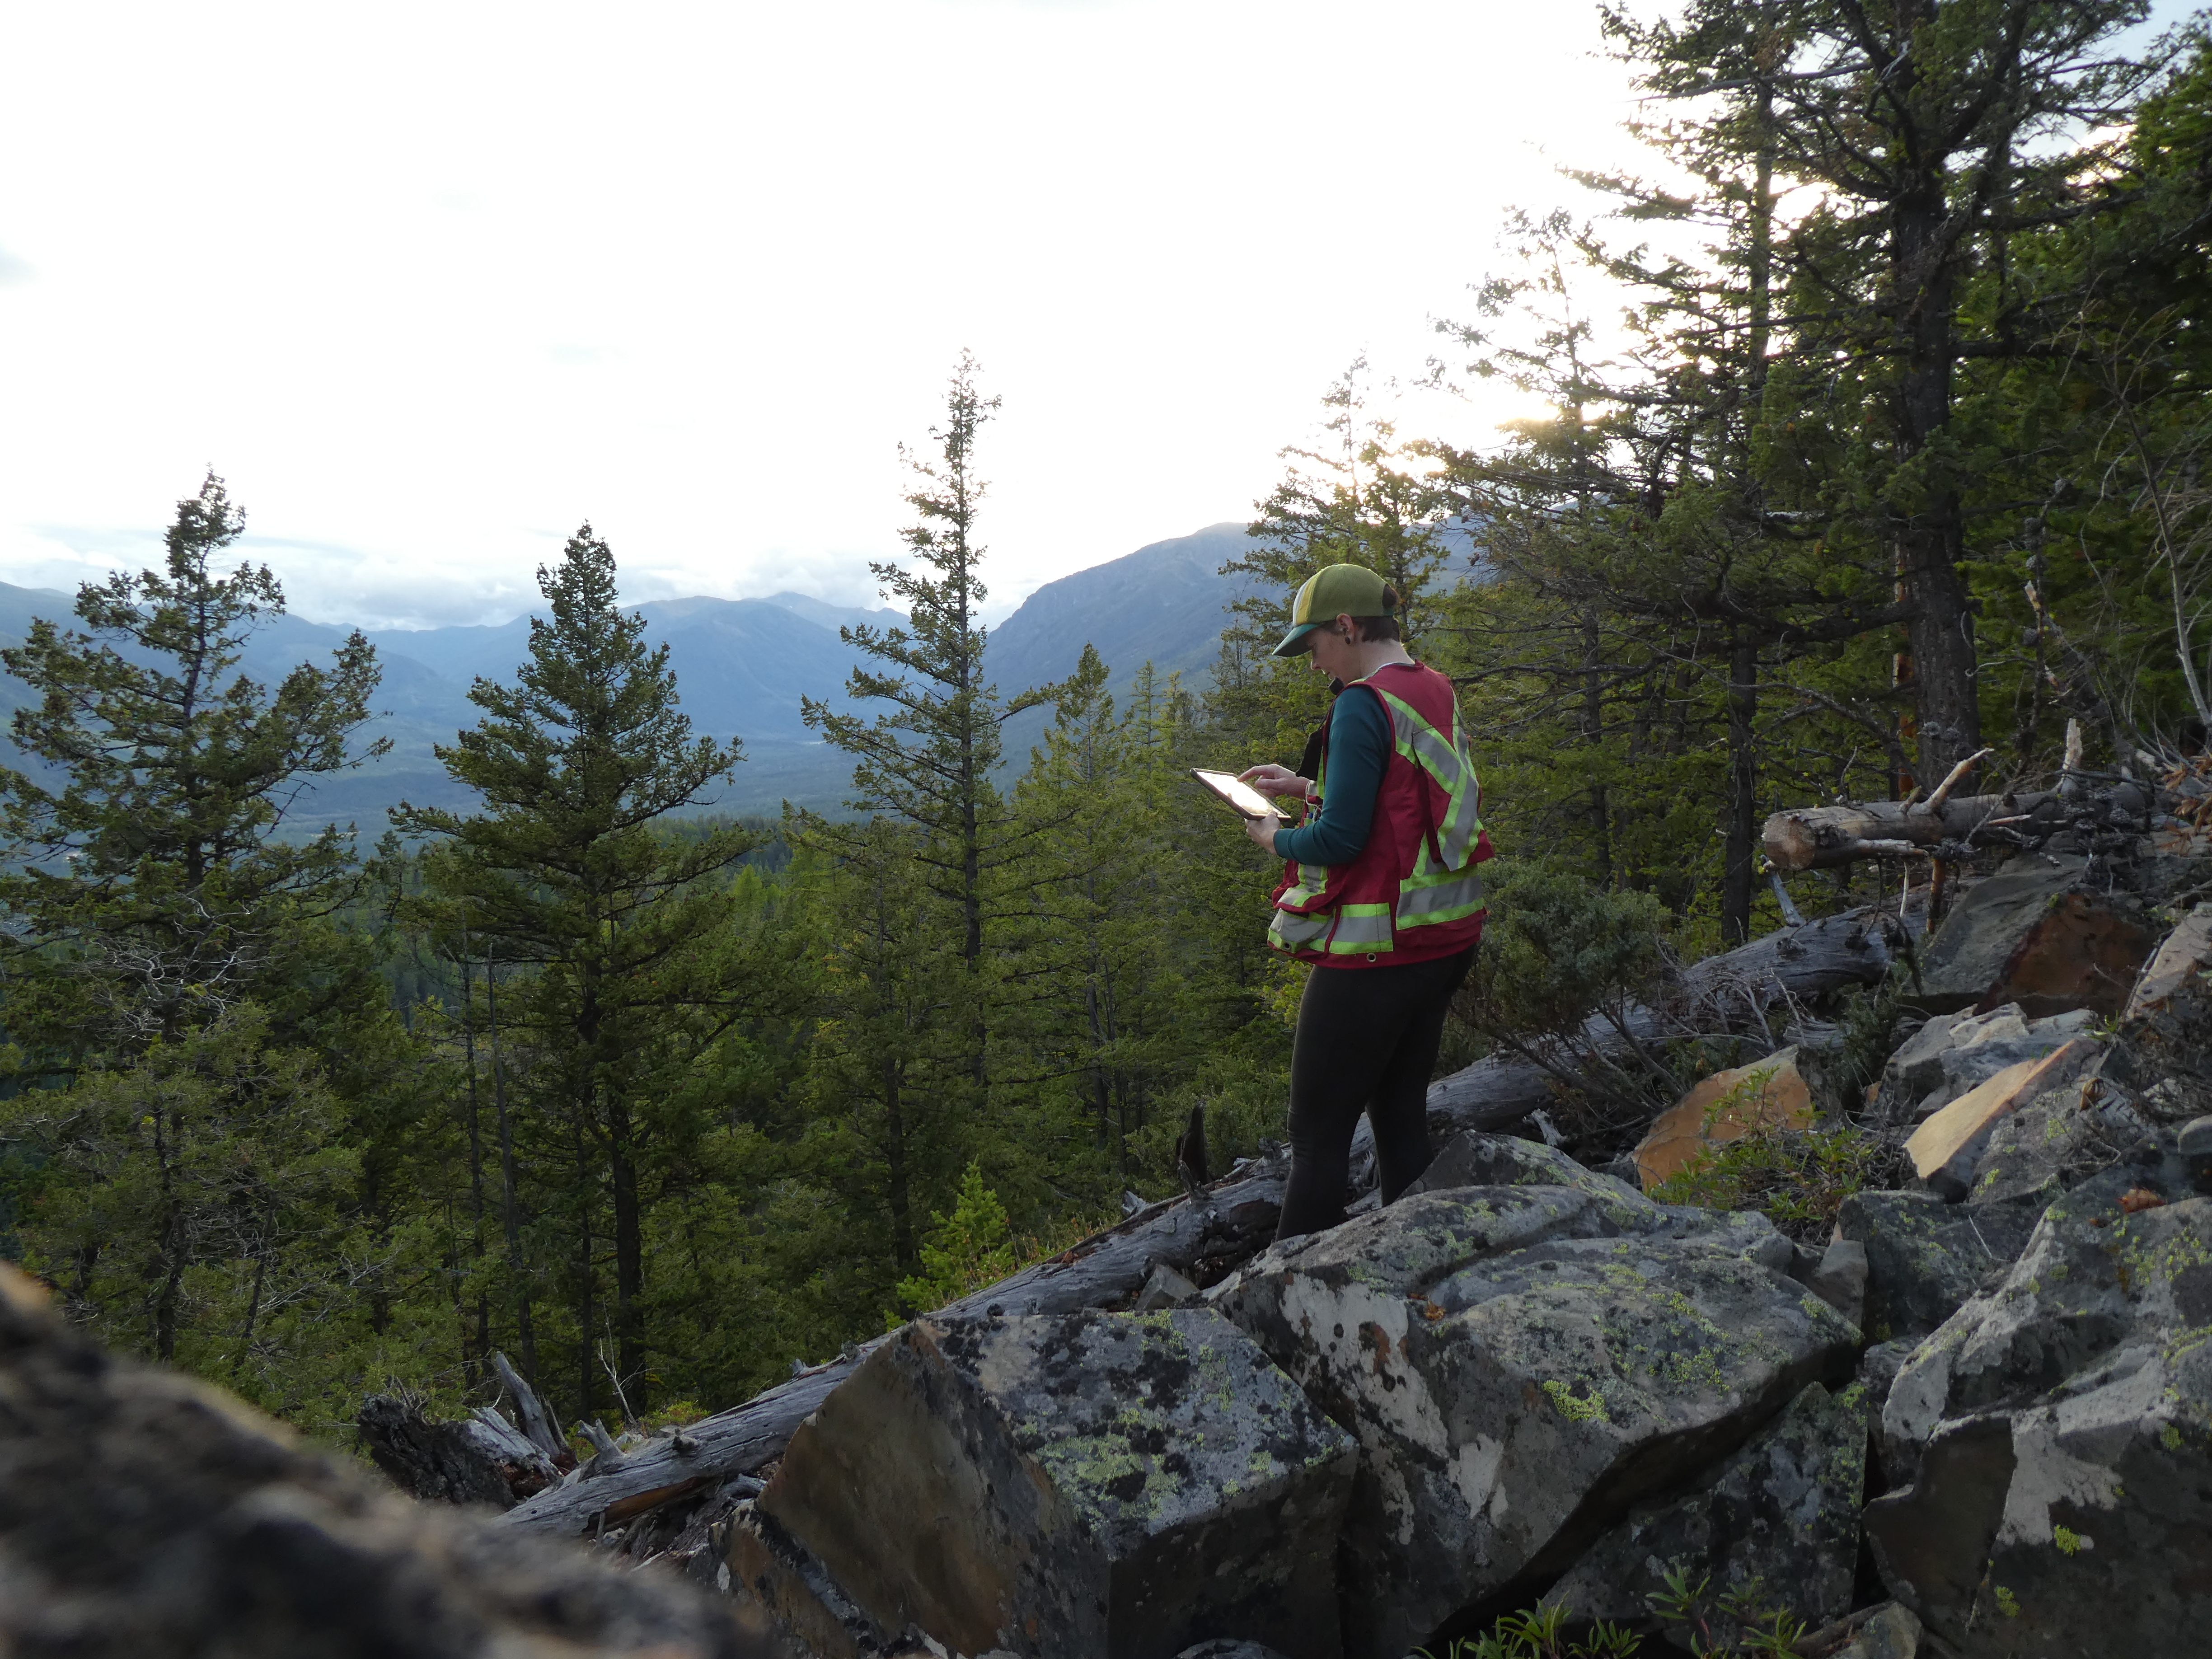
By Rohanna Gibson, Structural Geologist, Terrane Geoscience
Goal
To collect new data on bedrock geology and view existing geoscience data
in the field. Geologic mapping is completed using paper maps and/or
digital devices for data collection. The goal is to improve the geologic
mapping workflow by entering data directly in the field, create quality
data with consistent terms, and reference existing geoscience data in
the field.
Project preparation
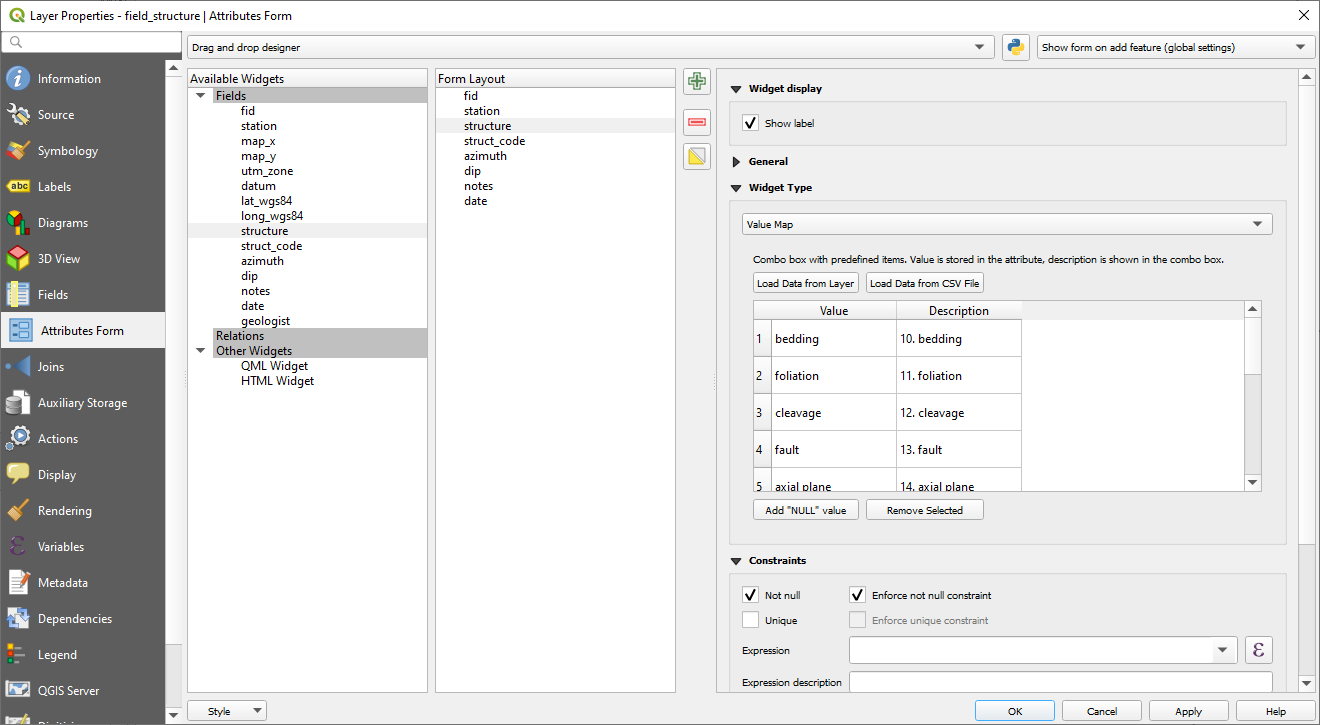
Prior to starting in QField, a geologic mapping GeoPackage was designed to collect vector data including point station, structure, photo, and sample layers as well as line and polygon layers for contacts, faults, alteration, and geology.
Attribute fields are customized for ease of data entry and data quality assurance using value maps, defaults (value
or expression), and constraints within the Attributes Form.
For example,
the structural layer includes:
Coordinates
Fields with default value x and y coordinates from GPS data.
Structure type
Value map (drop down list) with structural features (e.g., bedding,
cleavage, lineation), set with a “not null” constraint.
Azimuth and dip
Integers with range set from 0-360 and 0-90, respectively.
Date
Default value current date and time when feature created
Symbology and labels are customized for each layer, including embedded
SVG symbols for structural features that are rotated with the azimuth
field.
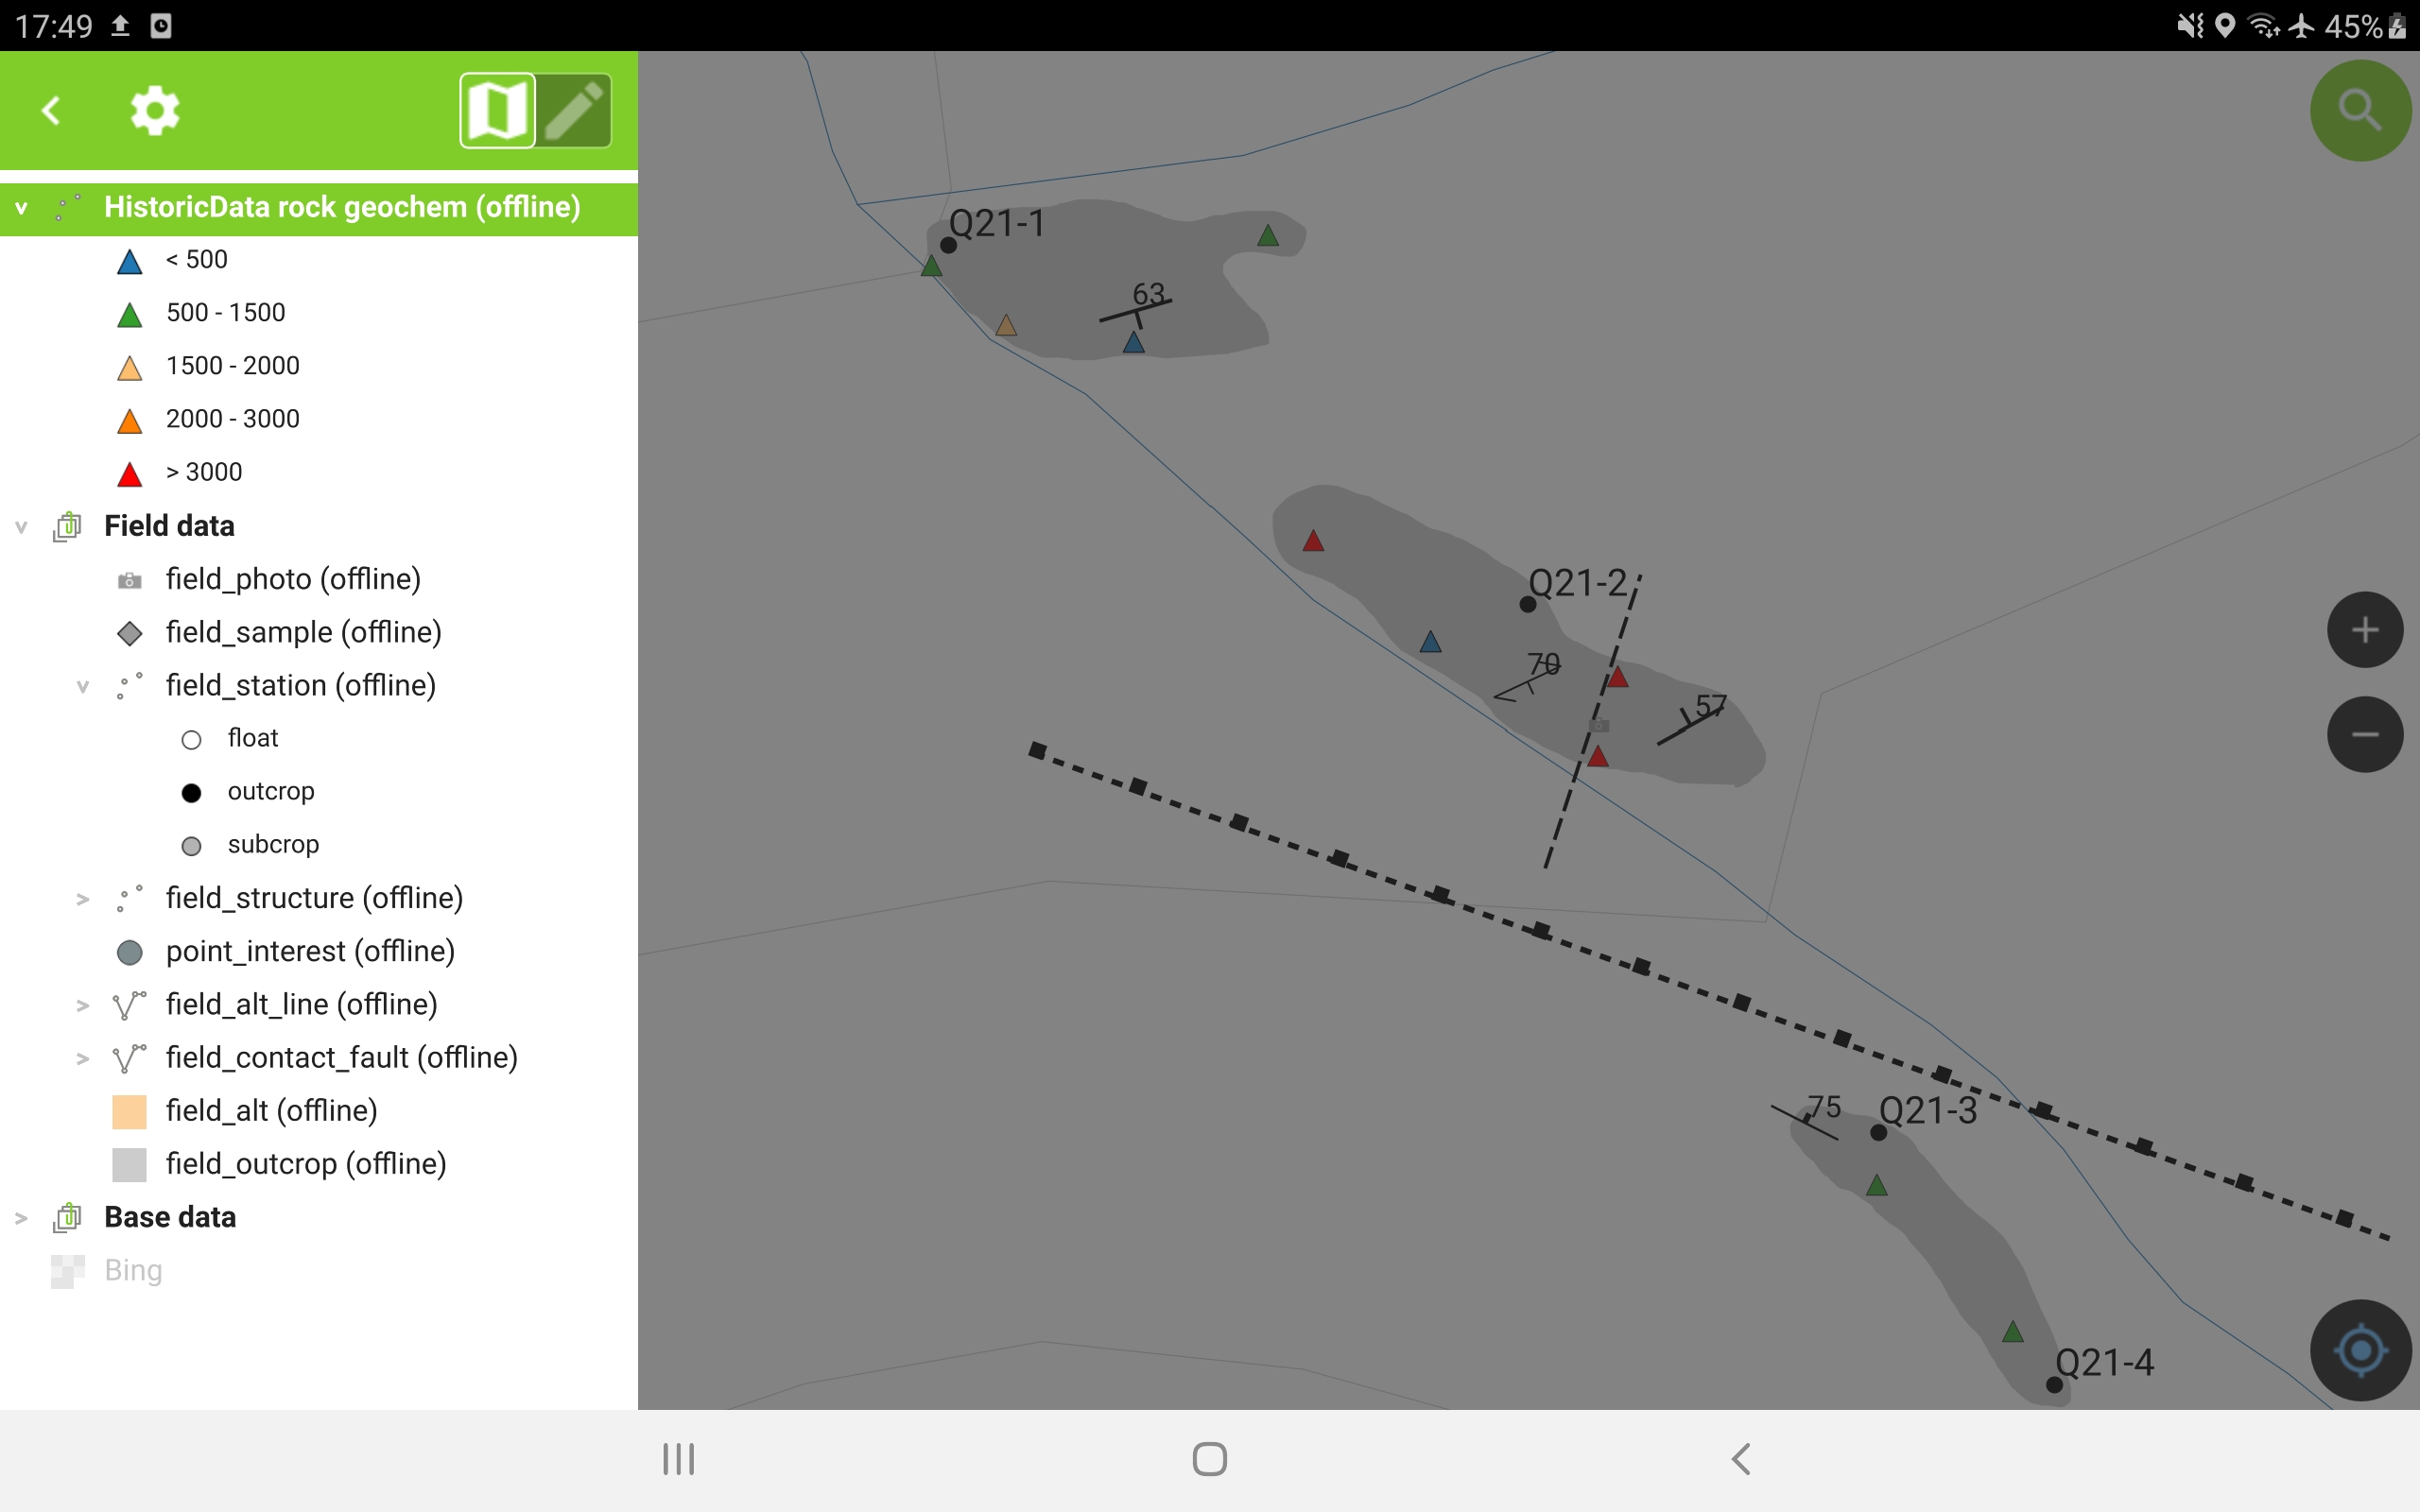
In addition to field data, base maps and historic data are compiled into
GeoPackage for reference.
Base maps include vector topographic data and raster orthophotos.
Raster geophysical data and vector geochemical data are included if available, as well as historic geologic mapping.
Map themes are designed to quickly toggle between geologic mapping,
geophysics, and geochemistry views.
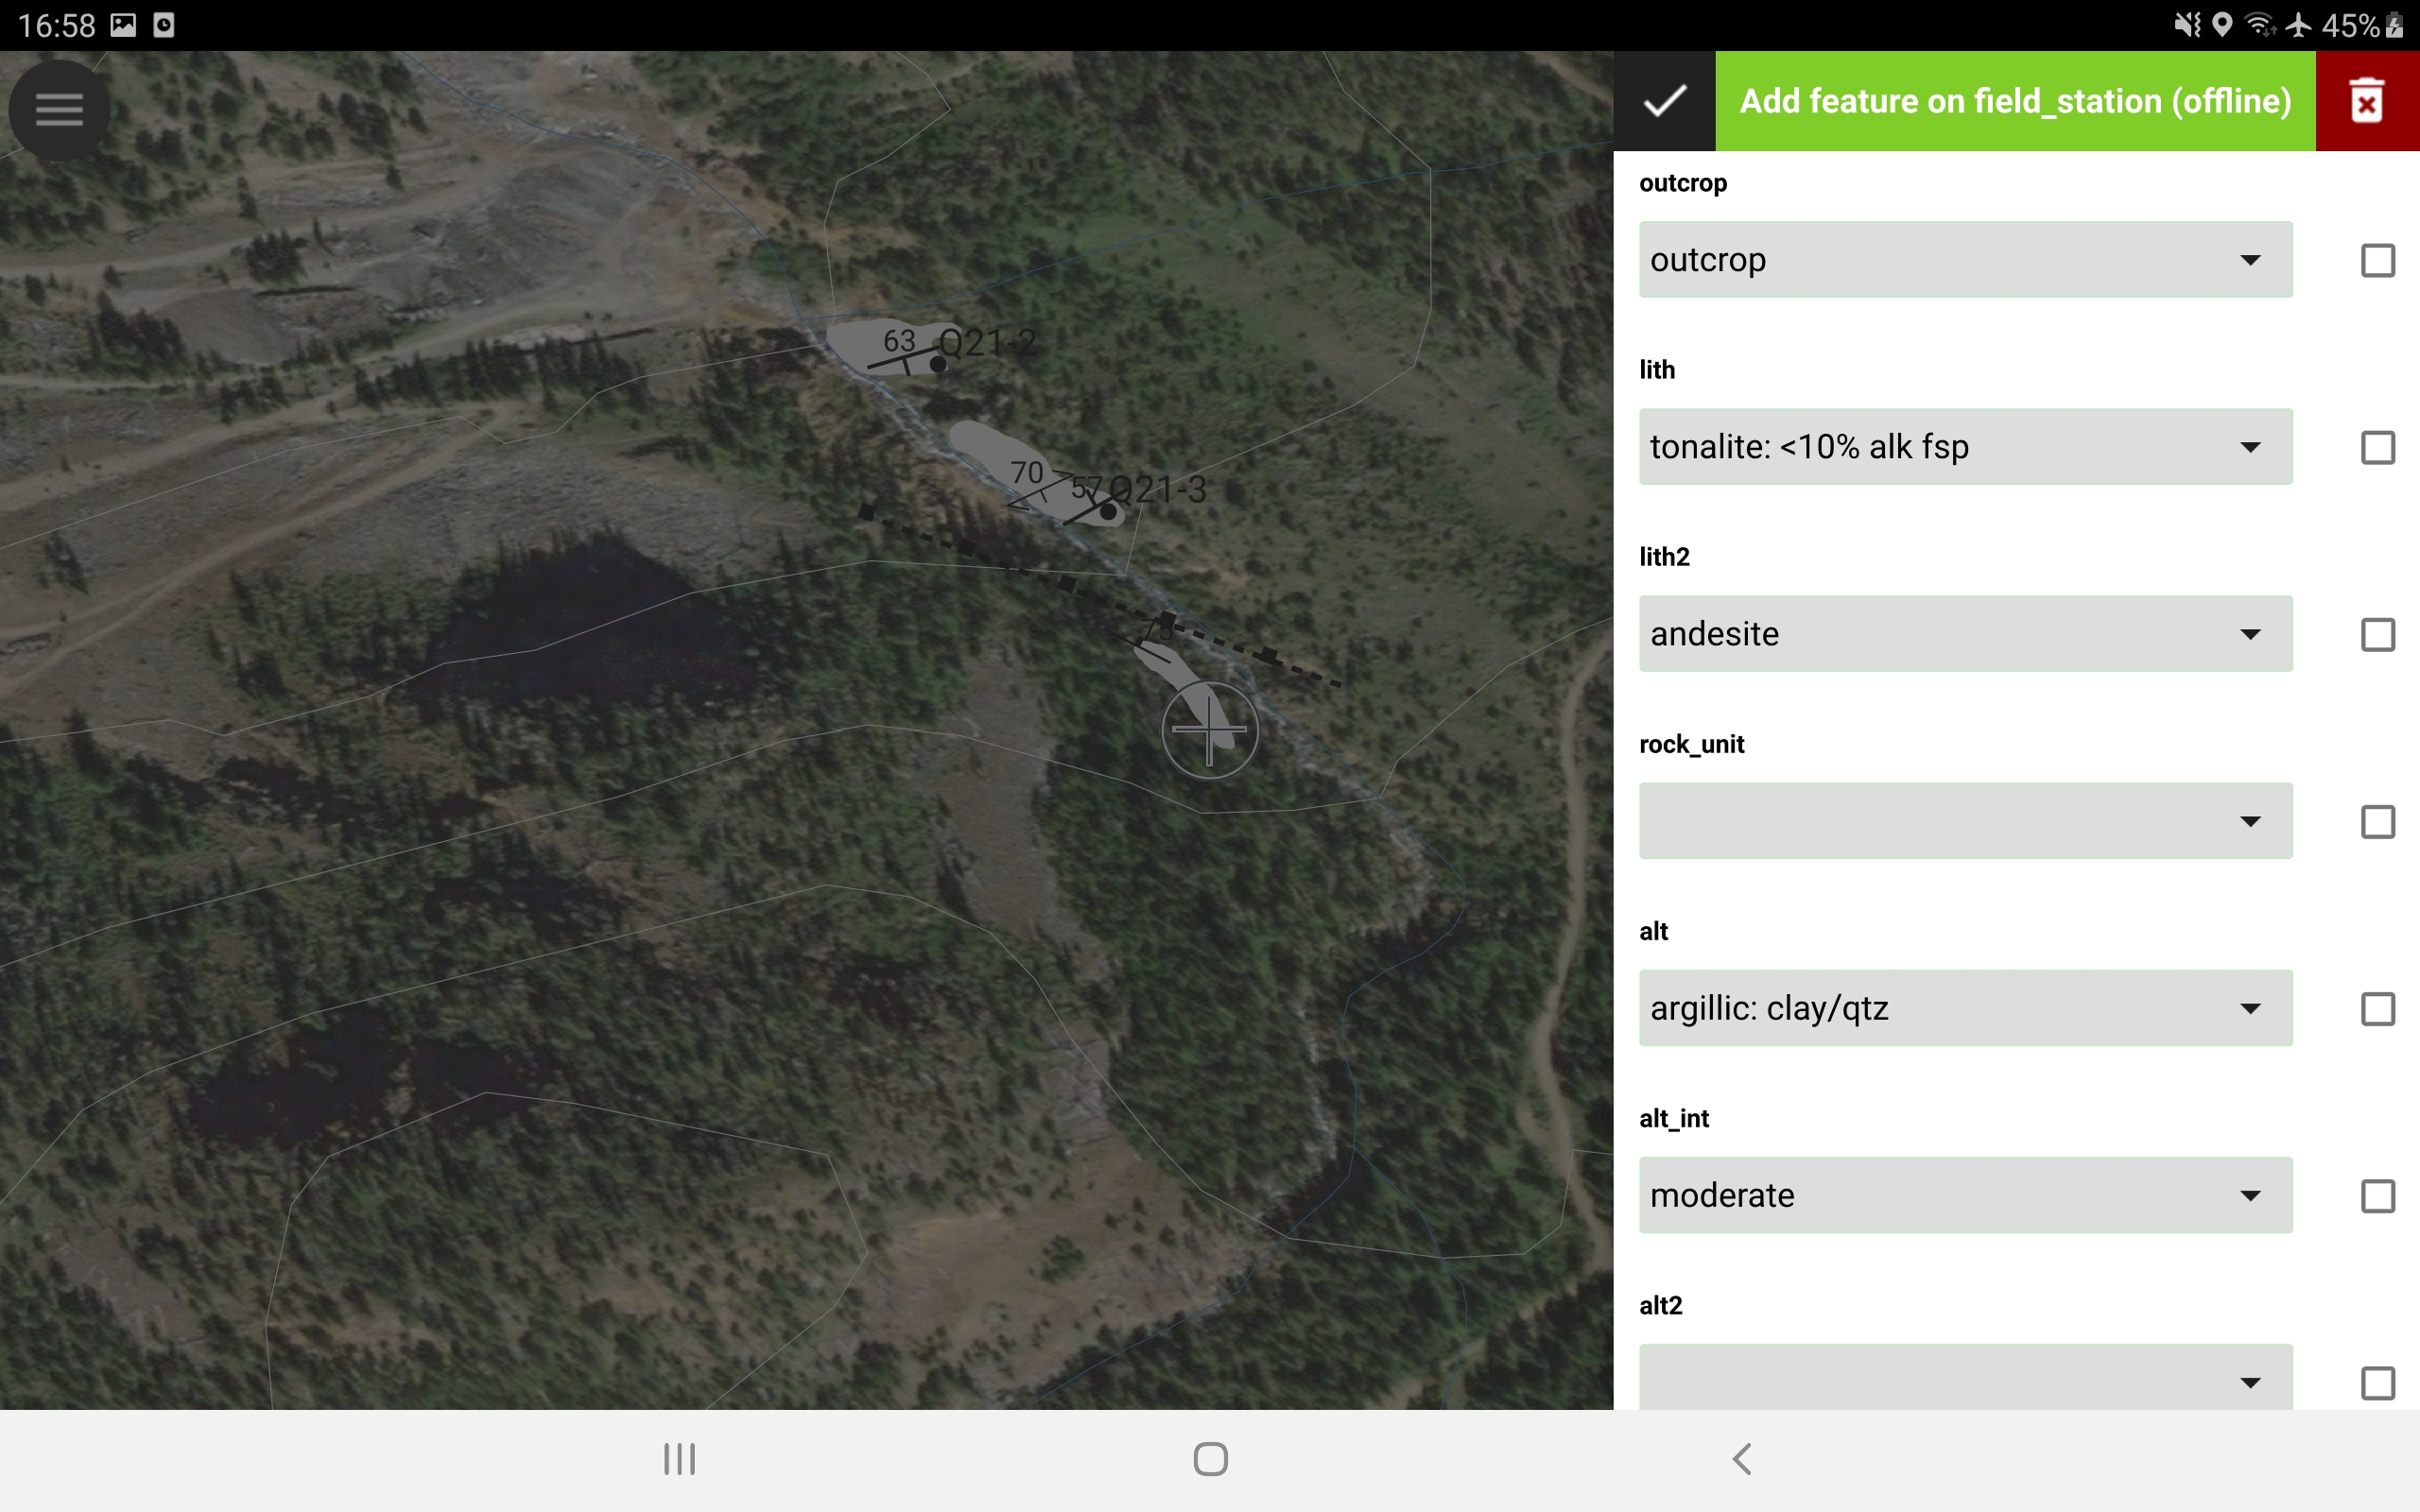
Data collection
Field data collection includes adding point data for map stations, structures, photos, and samples.
Polygons and lines are drawn freehand with a stylus or adding vertices manually.
Location and direction of travel are displayed using internal device GPS (or external GPS device linked via Bluetooth), historic vector and raster layers can be viewed relative to location.
Current and historic vector layers can be searched and viewed in QField.
Field data are synchronized in QGIS followed by a short data clean up and verification process.
The QGIS project is then exported back to QField for additional data collection.
Structural data collection may be upgraded with future development of a geologic compass feature.
https://github.com/opengisch/QField/issues/1882
Results
Final geologic maps and analysis are prepared directly from field data sets with no need to digitize field data.
Depending on proficiency and type of mapping, the QField geologic mapping workflow takes approximately the same amount of field time as manual (paper) mapping and drastically reduces office data digitization time.
Additionally, historic data are easily referred to in the field, allowing for real time interpretation and targeted field work.
Maps and attribute tables can be exported directly from QField or the QGIS project for daily field updates or communication between working groups.
QField allows for data integrity with customizable attribute fields and database compatibility.
Field data quality assurance can be built in during project design, ensuring attributes are consistent between users and reducing human error with constraints and default values.
Related Articles
Mapping breeding birds
The original version of this document is located at https://docs.qfield.org/success-stories/mapping-breeding-birds-in-the-Wadden-Sea Use of QField for mapping breeding birds in the Wadden Sea By Benjamin Gnep, Schutzstation Wattenmeer e.V. 29.07.2019 ...Sample projects
The original version of this document is located at https://docs.qfield.org/get-started/sample-projects Sample projects QField ships sample projects by default. You can use these projects to explore some of the QField configuration details in QGIS ...Ground Truth Data Collection
The original version of this document is located at https://docs.qfield.org/success-stories/lulc-mapping-fiji Ground Truth Data Collection Using QField for LULC Mapping in Fiji By Kevin Davies, School of Geosciences, The University of Sydney Purpose ...Project creation in QFieldCloud
The original version of this document is located at https://docs.qfield.org/get-started/tutorials/create-project-qfc Creating Projects in QFieldCloud There are multiple options available to initialize and build a project in QFieldCloud: Using QGIS ...Navigation
The original version of this document is located at https://docs.qfield.org/how-to/navigation-and-positioning/navigation Navigation QField offers navigation functionalities to help orient yourself in the field and accurately reach a given ...