All about GPS, GNSS and NTRIP
The original version of this document is located at https://docs.qfield.org/how-to/navigation-and-positioning/gnss
Positioning (GNSS)
QField is capable to show your live position using several sources:
- Either by using the internal GNSS (Global Navigation Satellite System, like GPS, GLONASS, Galileo or Beidou) of your mobile device (typically 5 m accuracy) or
- Through an external antenna through NMEA streams over Bluetooth, TCP, or UDP connection. (typically 1.5 m accuracy) or
- Through an external antenna connected to an additional NTRIP service (down to cm accuracy)
Tip
Depending on your technical domain, it is advisable to make use of an external antenna, given that the known limitation of a mobile device is around 5 meters.
Furthermore, an external antenna is also able to measure the altitude next to the current 2D position on the earth surface.
Note
QField requires external GNSS devices to output their position in EPSG:4326.
Support for customized CRSes is not possible.
This may lead to displacements of your data, if you are not careful.
Visualization
When positioning is enabled, your position will be shown in blue on the map.
Your location is represented by a blue dot when you are not moving and by an arrow indicating your movement direction if you are moving.
The blue beam indicates the current orientation of your device if the device has a builtin magnetic compass.
A shaded circle around your current position indicates the precision as reported by the GPS in use.
Configuration
The following settings are available in QField settings’ positioning tab.
Workflow
- Open the side dashboard and click on the 3-dotted menu
- Tap on settings and switch to the Positioning tab
Enable NTRIP Corrections
If you have access to an RTK Service, QField can act as a RTK Client if you add the essential information under the settings.
Workflow
Connect to external GPS Device
- Enable bluetooth and connect to your external GPS Device
- In QField connect to that antenna by adding it to your selection of positioning devices
- Once connected, toggle the switch

- Click on the settings button next to the switch and add your NTRIP Service information

- Once added click on the arrow and ensure that the NTRIP correction is working as expected (indicated by incoming and outgoing arrows)

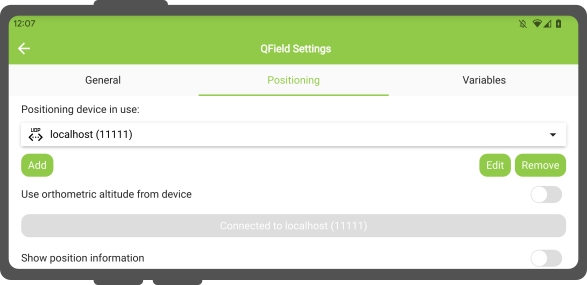
NOTE: If you enable your position information in the settings you can see the established connection.
Show position information
You can lock the crosshair to your position (meaning you will record a point or vertex exactly at your location).
Depending on your preference you may choose between three different behaviours as indicated below:

- Follow position only: The map canvas will stay as it is
- Follow position and compass orientation: The map canvas will rotate in such a way that your compass always points towards the top of your screen
- Follow position and your movement direction: The map will always rotate in the way of your movement direction
Workflow
- Turn on your positioning
- Tap on the crosshair to follow your position
Measure (M) value
When digitizing a geometry onto a vector layer that contains an M dimension, QField will add a measurement value to individual vertices whenever the coordinate cursor is locked to the current position.
By default, the value will represent the captured position’s timestamp (milliseconds since epoch).
You can change this value using the combo box in the settings’ positioning tab.
The available values to chose from are.
- timestamp
- ground speed
- bearing
- horizontal and vertical accuracy
- PDOP, HDOP and VDOP
Accuracy requirement
A minimum desired accuracy for measurements can be defined.
The quality will be reported in three classes, bad (red), ok (yellow) and excellent (green).
These colors will show up as a dot on top of the GNSS button.

The thresholds can be defined in the settings’ positioning tab.
Note
If the Enable accuracy requirement setting is activated, you will not be able to collect new measurements with the coordinate cursor locked to the current position with an accuracy value which is bad (red).
Antenna height compensation
The height of the antenna pole in use can be defined in the settings.
Any measured altitude will be corrected by this value.
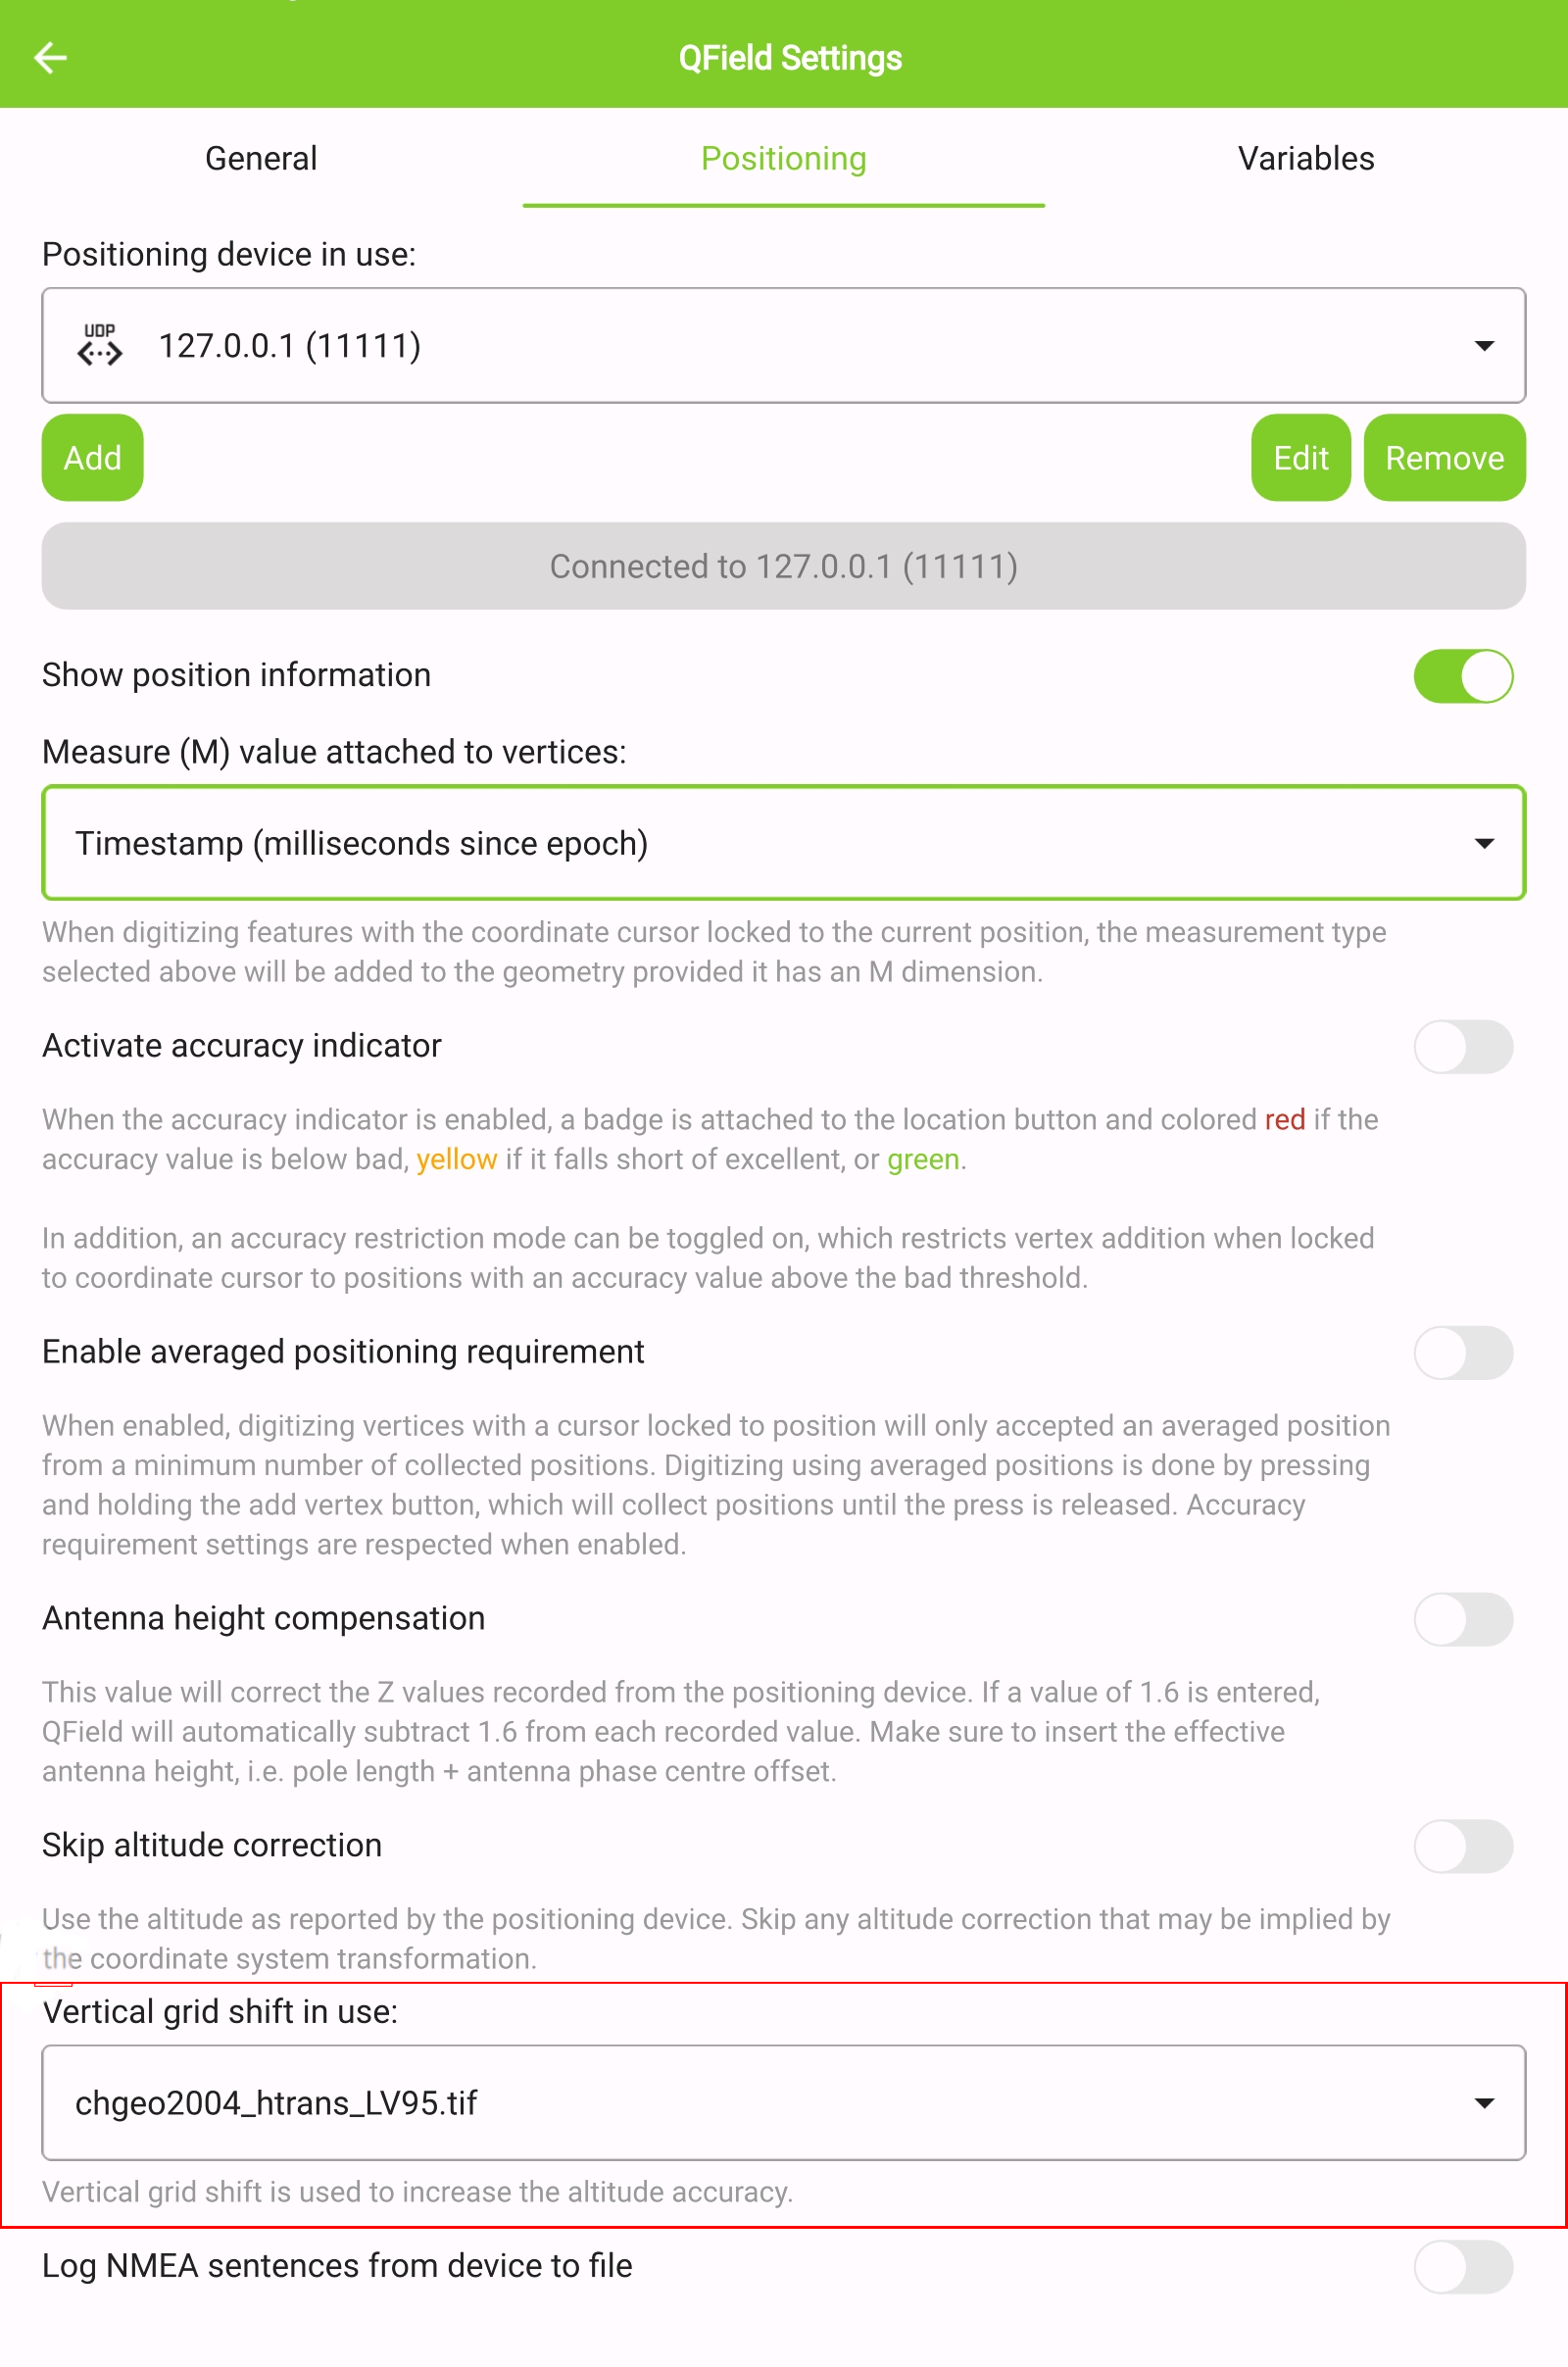
Altitude correction / vertical grid shift
Altitude values can be corrected with vertical grid shift files to calculate orthometric height.
Vertical grid shift files have to be made available to QField by putting them into the QField app folder [App Directory]/QField/proj.
Once the grid shift file is placed there, it is available in QField in the Positioning settings under Vertical grid shift in use.
If you are using altitude correction and an external positioning device is used, consider turning Use orthometric altitude from device off.
The formats currently supported are:
- GeoTIFF (.tif, .tiff)
- NOAA Vertical Datum (.gtx)
- NTv2 Datum Grid Shift (.gsb)
- Natural Resources Canada’s Geoid (.byn)
Workflow
Example: Netherlands - ETRS89 to NAP
For transformations involving the Dutch NAP (Normaal Amsterdams Peil) vertical datum, you’ll need the official grid file from NSGI.
- Download the file: Get
nlgeo2018.gtxdirectly from the NSGI website. - Place the downloaded
.gtxfile into the directory [App Directory]/QField/proj.
This is independent of whether you are using QFieldCloud or not.
Example: Switzerland - CH1903+/LV95
To get precise altitude data for Cadastral Surveying in Switzerland (LV95), you must use the geoid correction grid from Swisstopo.
The official file comes in an .agr format and must be converted to .gtx (NTv2 Grid Shift File) before it can be used.
Other raster formats like (.tiff) can also be used.
- Download the “Geoid OGD” dataset from Swisstopo under the following link Download Link: Geoid OGD from Swisstopo.
- Unzip the archive to retrieve the file:
chgeo2004_htrans_LV95.agr. -
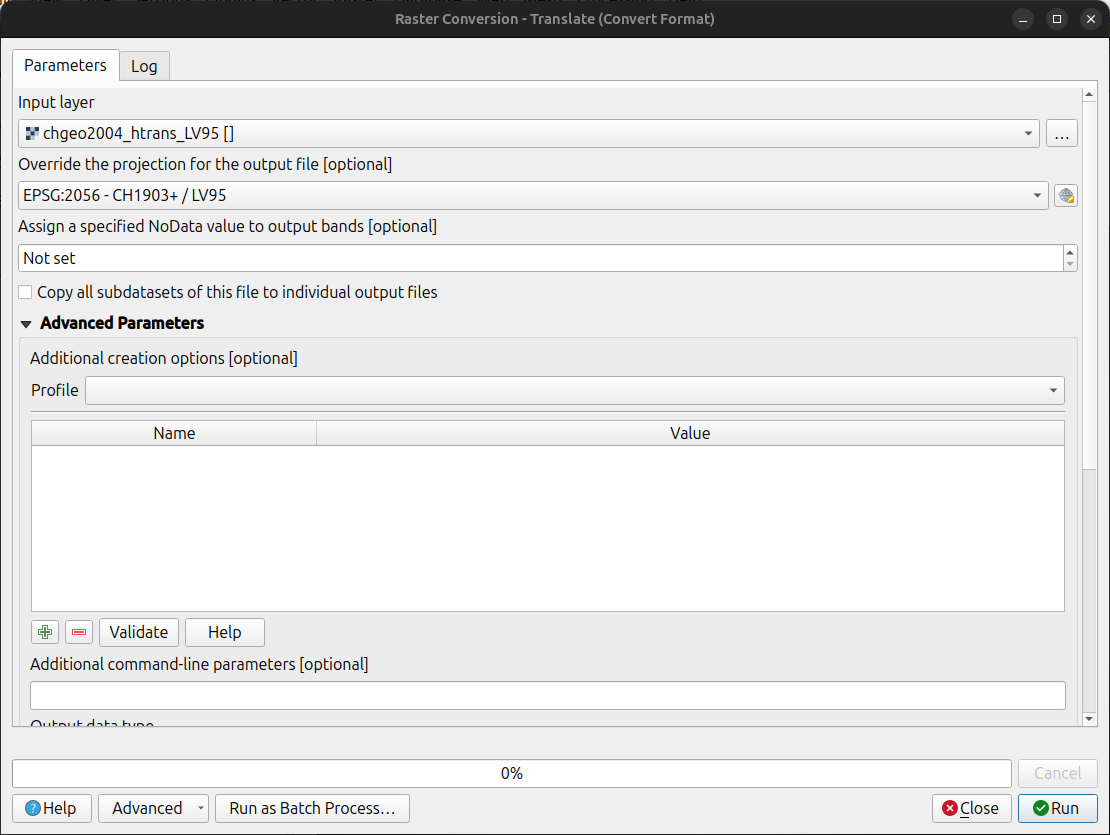
Convert the file using the using the gdal_translate algorithm with one of the following options:
Method 1: QGIS Graphical User Interface (GUI)
- In QGIS, open the Processing Toolbox panel.
- Navigate to GDAL > Raster conversion > Translate (Convert format) tool.
- Configure it with your needed requirements:
- Input layer: Select your
chgeo2004_htrans_LV95.agrfile. - Output file: Click “Save to File…” and name your output file with a
.gtxextension (or other format needed), for example,chgeo2004_htrans_LV95.gtx.
- Input layer: Select your
- Click Run. The other default settings are typically sufficient for this conversion.
Method 2: Command Line (
qgis_process)For automation or users who prefer the command line,
qgis_processis a great option.- Open your terminal and run the following command, adjusting the paths to your files.
bash
qgis_process run gdal:translate --INPUT="/path/to/your/chgeo2004_htrans_LV95.agr"
    --OUTPUT="/path/to/your/chgeo2004_htrans_LV95.gtx"
Method 3: PyQGIS Script
You can also perform the conversion programmatically within the QGIS Python Console or a standalone script.
```python
import processinginput_grid = ‘/path/to/your/chgeo2004_htrans_LV95.agr’
output_grid = ‘/path/to/your/chgeo2004_htrans_LV95.gtx’processing.run(“gdal:translate”, {
‘INPUT’: input_grid,
‘OUTPUT’: output_grid
})print(f”Successfully converted grid to: {output_grid}”)
```
📱 Fieldwork
-
Copy the
chgeo2004_htrans_LV95.gtxfile to the directory [App Directory]/QField/proj on your mobile device. -
Open the Site Dashboard
-
Tap on the 3-dotted menu (⋮) and direct to Settings > Positioning
-
Enable your GNSS device.
It will directly center to your current location once the positioning information is available. -
Change to edit mode and press on the target button - the cross in the center means it is using GNSS positioning.
A long press on the GNSS button will show the positioning menu.
Inside the menu you can turn on the Show position information which will show the current coordinates that are reprojected into the CRS of your project along with the precision information.
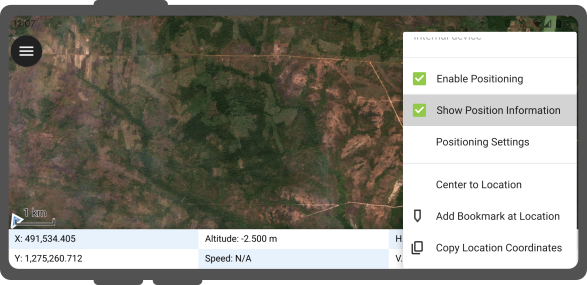
Note
If you see WGS 84 lat/lon information instead of information in your project CRS, you probably have no signal yet.
Positioning variables
You can get the positioning information both of your internal and external device by specifically configuring your attribute form.
These variables are commonly used as part of default values expressions
for fields to keep track of the quality of individual measured points.
A common use case is recording the horizontal accuracy, which can be done by using the variable @position_horizontal_accuracy.
For a complete listing of all available variables, refer to the expression variables reference documentation.
Information for GNSS Z value with Vertical grid shift in use:
- Antenna height compensation=False
| Vertical Grid Shift in use | point Z Value z(geometry) | GNSS Device z(@position_coordinate) | QField Display | QField Label |
|---|---|---|---|---|
| None | Z ellipsoidal device value | Z ellipsoidal device value | Z ellipsoidal device value | Altitude: xxx.xxxx m |
| Orthometric from device | Z orthometric device value | Z orthometric device value | Z orthometric device value | Altitude: xxx.xxxx m (ortho.) |
| USER_Shift_Grid.GTX vertical grid shift |
Z shiftgrid value | Z ellipsoidal device value | Z shiftgrid value | Altitude: xxx.xxxx m (grid) |
Capturing longitude, latitude and altitude in attribute form
It is useful and not uncommon that the actual positioning values should be automatically stored inside the attribute form.
This applies for longitude, latitude and altitude.
Workflow
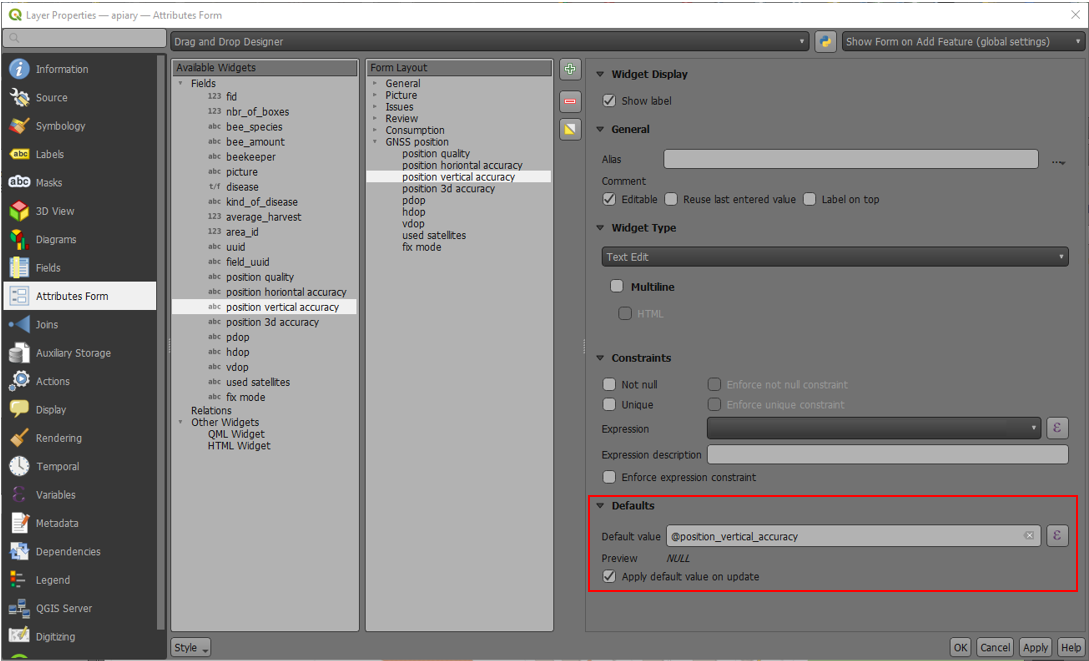
Configuration of attribute form
- In QGIS direct to your Layer Properties > Attribute Form
- (Optional): You have to add a field of decimal type to the form that can capture the data.
Name it accordingly (eg. “longitude”) -
Under the settings of the widget display of the corresponding field add the following default value:
- Longitude:
x(@position_coordinate) - Latitude:
y(@position_coordinate) - Altitude:
z(@position_coordinate)
- Longitude:
This will save the coordinate directly in the field when adding a new feature.
Note
This only works if positioning is turned on and when you have locked your position to your crosshair.
Vertex log layer
It is good practice to create a log layer of the collected vertices.
It enables you to keep track of the meta data for each vertex like GNSS quality attributes and more.
Workflow
- Add a point layer to the project and attributes configured to store this information.
- Assign the role digitizing logger to a point layer.
- Go to > Project > Properties… > QField.
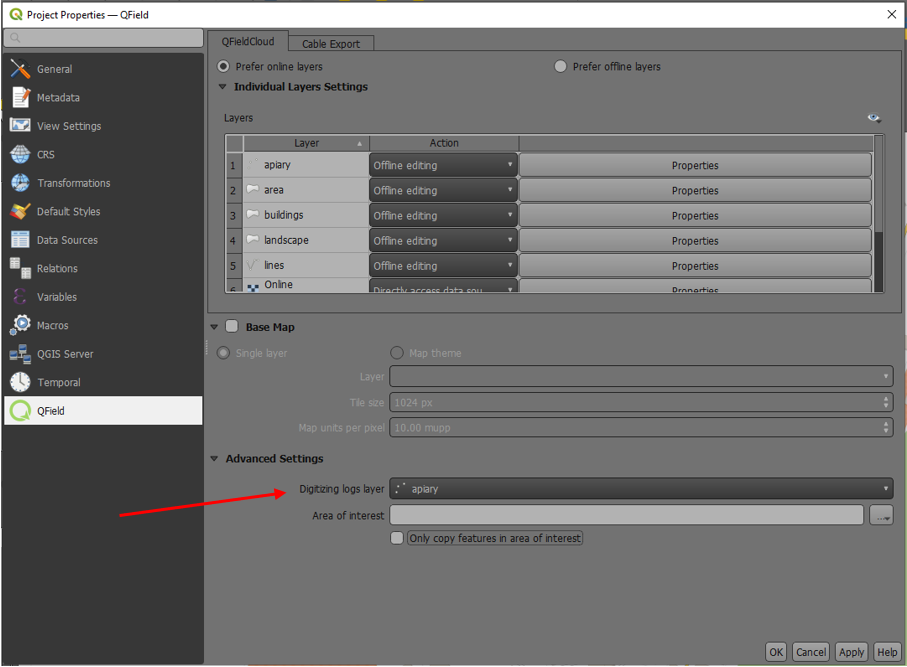
- Set default values to the attributes using the positioning variables mentioned above.
Using an external GNSS Receiver
📱 Fieldwork
QField supports connecting to external GNSS positioning devices via NMEA streams through Bluetooth, TCP,
or UDP connections.
Under the Positioning section, you are able to manage and switch between your internal and saved external GNSS devices.
The breakdown of connections support by platform is as follow:
| 🤖 Android | 🍏 iOS | 🪟 Windows | 🐧 Linux | 🍏 MacOS | |
|---|---|---|---|---|---|
| Bluetooth | ✅ | ✅ | ✅ | ✅ | |
| TCP | ✅ | ✅ | ✅ | ✅ | ✅ |
| UDP | ✅ | ✅ | ✅ | ✅ | ✅ |
| Serial port | ✅ | ✅ | ✅ | ✅ |
(*) Bluetooth support on Windows occurs through the virtual serial port automatically
created by the operating system when it connects to the GNSS device.
The NMEA sentences currently supported are GGA, RMC, GSA, GSV, GST, VTG, HDG and HDT.
Note
Make sure no other app like mock location providers are using the same connection.
External receiver log
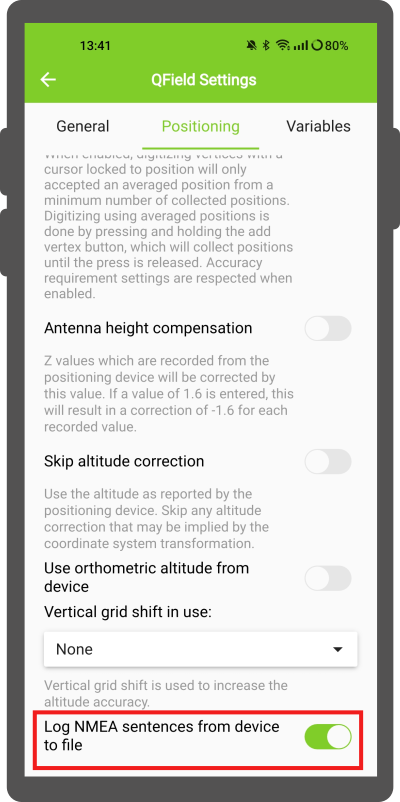
If you have selected an external receiver as the positioning device, you will find a switch Log NMEA sentences from device to file.
If this is activated, all NMEA sentences coming from external positioning devices will be logged to a file.
The logs will be placed in [App Directory]/QField/logs.
Note
Be aware that if the log is always turned on, it will fill up all the storage.
Mock location
📱 Fieldwork
It is possible to provide a mock location via a separate android app to
QField. There are several options for this, one of them is Android NTRIP Client.
To use this you have to enable mock locations on your Android device.
Averaged positioning functionality
📱 Fieldwork
Note
The coordinate cursor must be locked to the current location via the Lock to position button
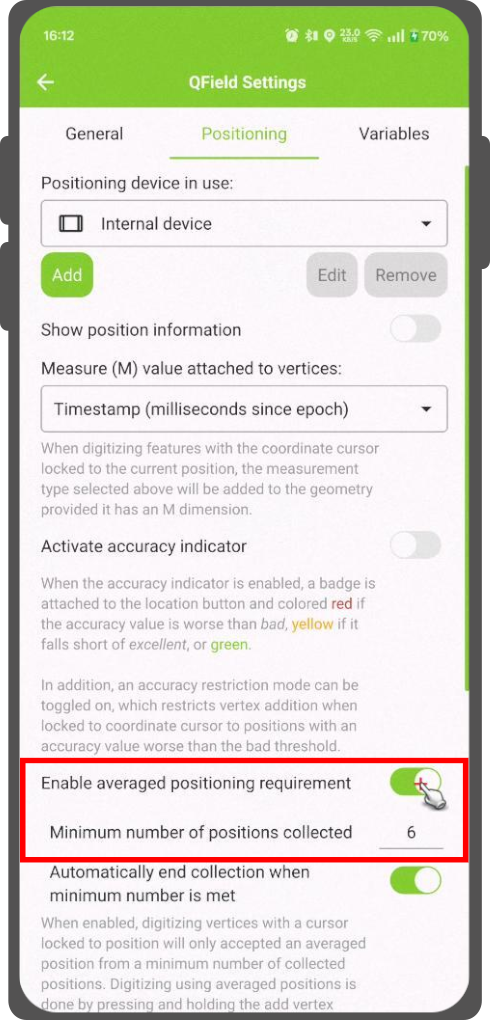
There is a function that allows you to digitize using averaged positions.
The survey will start by pressing and holding the add vertex button, which will start collecting positions.
During the collection, an indicator will appear on top of the coordinate cursor showing the number number of the collected positions.
If an averaged position minimum count requirement is active, a progress bar will also be present indicating the progress towards meeting that requirement.
- To activate direct to side “Dashboard” > Settings > Positioning
- Shortly tap where you want to collect points and QField will automatically add the averaged position once the minimum count is met.
Note
When using @gnss_* or @position_ variables on averaged positions, the variable will also represent the average over all collected samples.
Related Articles
Expression variables
The original version of this document is located at https://docs.qfield.org/reference/expression_variables Expression Variables in QField QField supports various expression variables that can be used as field defaults, constraints or also to control ...Map decorations
The original version of this document is located at https://docs.qfield.org/how-to/qfield-interface/decorations Map Decorations ?️ Desktop preparation If you want to customise your project with “Decorations” in QField this can be done but you need ...3D Map view
The original version of this document is located at https://docs.qfield.org/how-to/advanced-how-tos/3d-map-view 3D Map View QField allows you to view your spatial data in 3D. By utilizing elevation data, map layers are draped as textures over the 3D ...Heritage Impact Assessment
The original version of this document is located at https://docs.qfield.org/success-stories/heritage-impact-assessment Heritage Impact Assessment using QField From QGIS to QField and Vice Versa: How the New Android Application Is Facilitating the ...Attachment widget
The original version of this document is located at https://docs.qfield.org/how-to/project-setup/pictures Use attachment In QField, a field with Attachment widget can be used to: Show and take photos Show and record videos Listen and record sound ...