Map decorations
The original version of this document is located at https://docs.qfield.org/how-to/qfield-interface/decorations
Map Decorations
🖥️ Desktop preparation
If you want to customise your project with “Decorations” in QField this can be done but you need to configure it first in QGIS.
More details you can find in the corresponding QGIS documentation
There are several decoration types to choose from:
- Grid: “A map grid” overlays the map with lines or markers at defined intervals providing spatial reference and guidance particularly useful in remote areas.
- Title Label: The “Title Label” adds a title to your map, which, for instance, allows you to display the project name.
- Copy Right Label: The “Copyright Label” is commonly used for branding purposes, indicating the origin of data sources or showing other information.
- Image: The image element allows you to directly place a logo, watermark or other means of graphic on your map.
- Scale Bar: Unlike the other elements enabling the Scale Bar can directly be done within the QField application settings, allowing for on-the-fly adjustments in the field.
Grid
Workflow
- In QGIS, navigate to View > Decorations > Grid….
- Check the Enable Grid box to activate it.
- Customize the grid’s appearance:
- Grid type: Choose between Solid lines, Crosses, or Markers.
- Interval: Set the spacing for the grid lines on both the X and Y axes.
The units are based on the project’s Coordinate Reference System (CRS).
- Line/Marker Symbol: Customize the color, thickness and style of the grid lines or markers to match your map style.
- Draw annotations: If enabled, this will display the grid coordinates on the map.
You can control the font, direction, and distance of the annotations from the map frame.
Once configured in QGIS, the grid will automatically be visible in QField once the saved project has been synchronized or was transferred manually.
Title Label
Workflow
- In QGIS, go to View > Decorations > Title Label….
- Check the Enable Title Label box.
- You can input static text or, for more powerful results, use a QGIS expression.
With expressions your title can dynamically change.
4. Click the Insert or Edit an Expression… button to open the expression builder.
Eg. A common use case is to display the project’s title, which is set in the Project > Properties… > General* tab.
sql
-- Displays the title saved in the project properties
[% @project_title %]
Example of a more complex title:
You can combine static text with variables and functions to create a more detailed title.
Code snippet
sql
-- Creates a title like: "Survey for Project *' %project_name% - 20xx"
'Survey for Project ' || [% @project_title %] || ' - ' || [% year(now()) %]
Copyright Label
Workflow
- In QGIS, select View > Decorations > Copyright Label….
- Check the Enable Copyright Label box.
- Like the Title Label, this decoration fully supports QGIS expressions.
Eg. Continuous display of your real-time GPS information on your map.
With the right configuration, you can show the current coordinates and map scale directly on the screen.
sql
-- Displays the GNSS coordinates and current map scale
Lat: [% format_number(y(@gnss_coordinate), 8) %] | Lon: [% format_number(x(@gnss_coordinate), 8) %]
Scale: 1:[% round(@map_scale) %]
The ability to use positioning variables (@gnss_coordinate) offers a streamlined way to display critical location data without cluttering the main user interface.
Image
Workflow
- In QGIS, open View > Decorations > Image….
- Check the Enable Image box.
- Click the … button in the Image path field to select your image.
Important: For seamless use in QField, it is highly recommended to store the image within the project folder and use a relative path.
- Create a dedicated folder inside your project directory (e.g.,
assets). - Reference the image using a path that starts with
./.
Example of a relative path:
./assets/company_logo.png
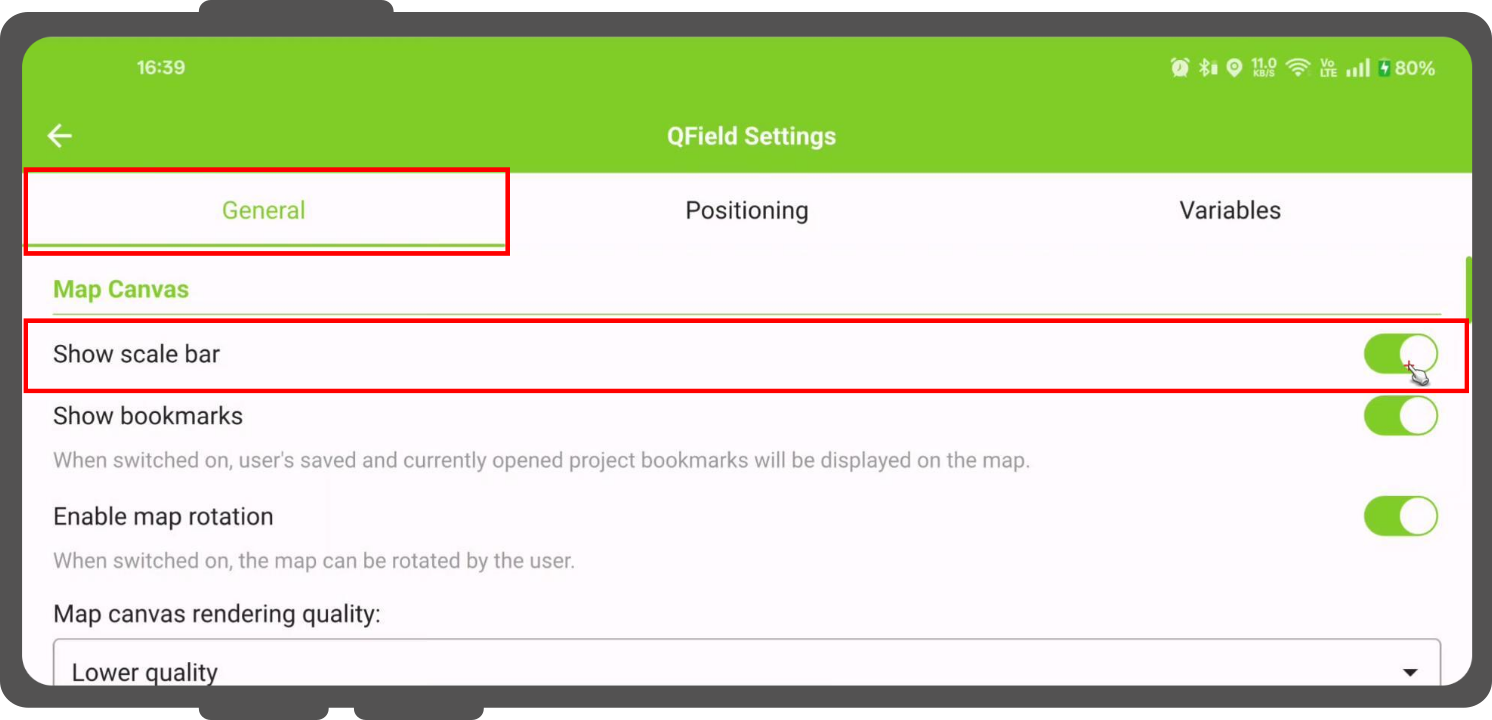
Scale Bar
📱 Fieldwork
Workflow
- Open your project in QField.
- Open the side “Dashboard” (☰).
- Tap the Settings icon (gear symbol) in the main menu.
- Under the General tab.
- Enable the Show scale bar .
Related Articles
Map themes
The original version of this document is located at https://docs.qfield.org/how-to/qfield-interface/map-themes Map themes The beautiful thing about GIS is that maps are dynamic. Layers can individually be shown and hidden and information can be ...Map styling
The original version of this document is located at https://docs.qfield.org/how-to/qfield-interface/map-styling Map styling All style settings from QGIS are directly supported by QField. This includes all renderer types like graduated, categorized, ...Interact with the map
The original version of this document is located at https://docs.qfield.org/how-to/qfield-interface/map-interaction Interact with the map Here are some of the possible interactions with the map in QField. Map legend ? Fieldwork Open the side ...3D Map view
The original version of this document is located at https://docs.qfield.org/how-to/advanced-how-tos/3d-map-view 3D Map View QField allows you to view your spatial data in 3D. By utilizing elevation data, map layers are draped as textures over the 3D ...Ground Truth Data Collection
The original version of this document is located at https://docs.qfield.org/success-stories/lulc-mapping-fiji Ground Truth Data Collection Using QField for LULC Mapping in Fiji By Kevin Davies, School of Geosciences, The University of Sydney Purpose ...